Slides from various corporate presentation slide decks. Colorful graphics and consistent use of typography helps simplify data to tell the story quickly. Complex processes and data are more easily grasped when made visible as shown in these slides for the Cisco Data & Analytics team.
*** note: confidential information has been redacted. ***

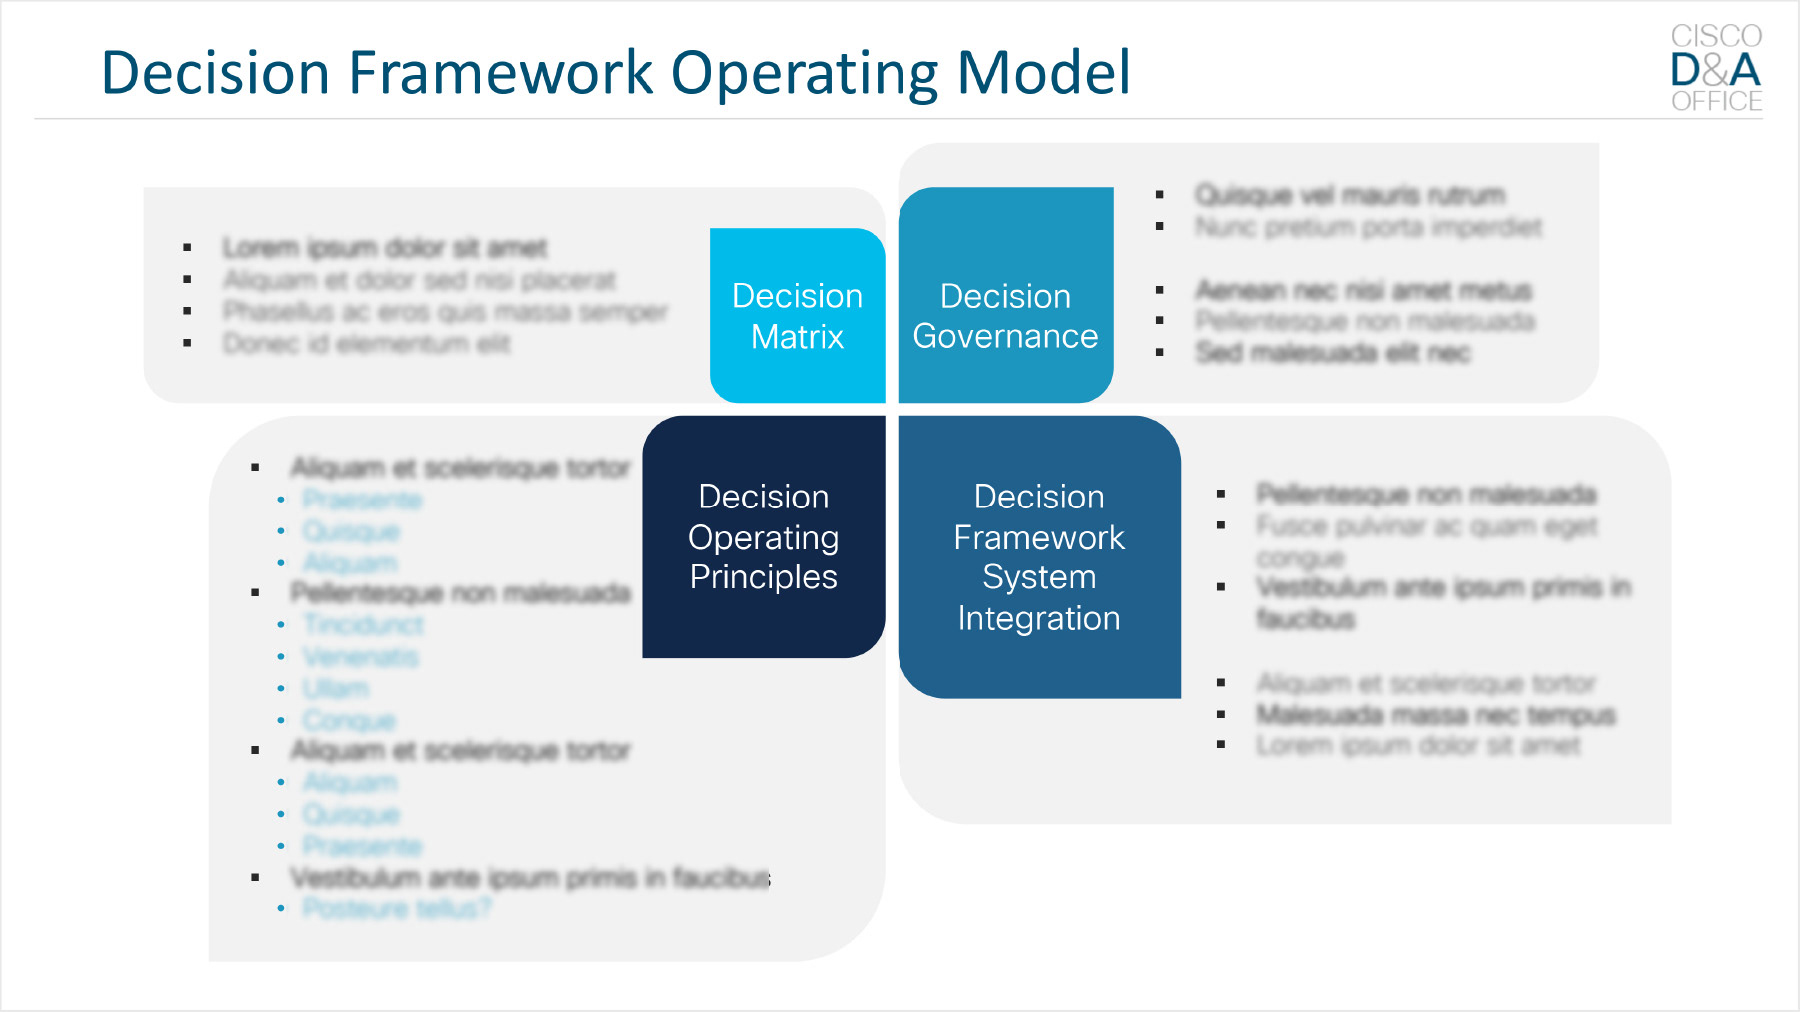
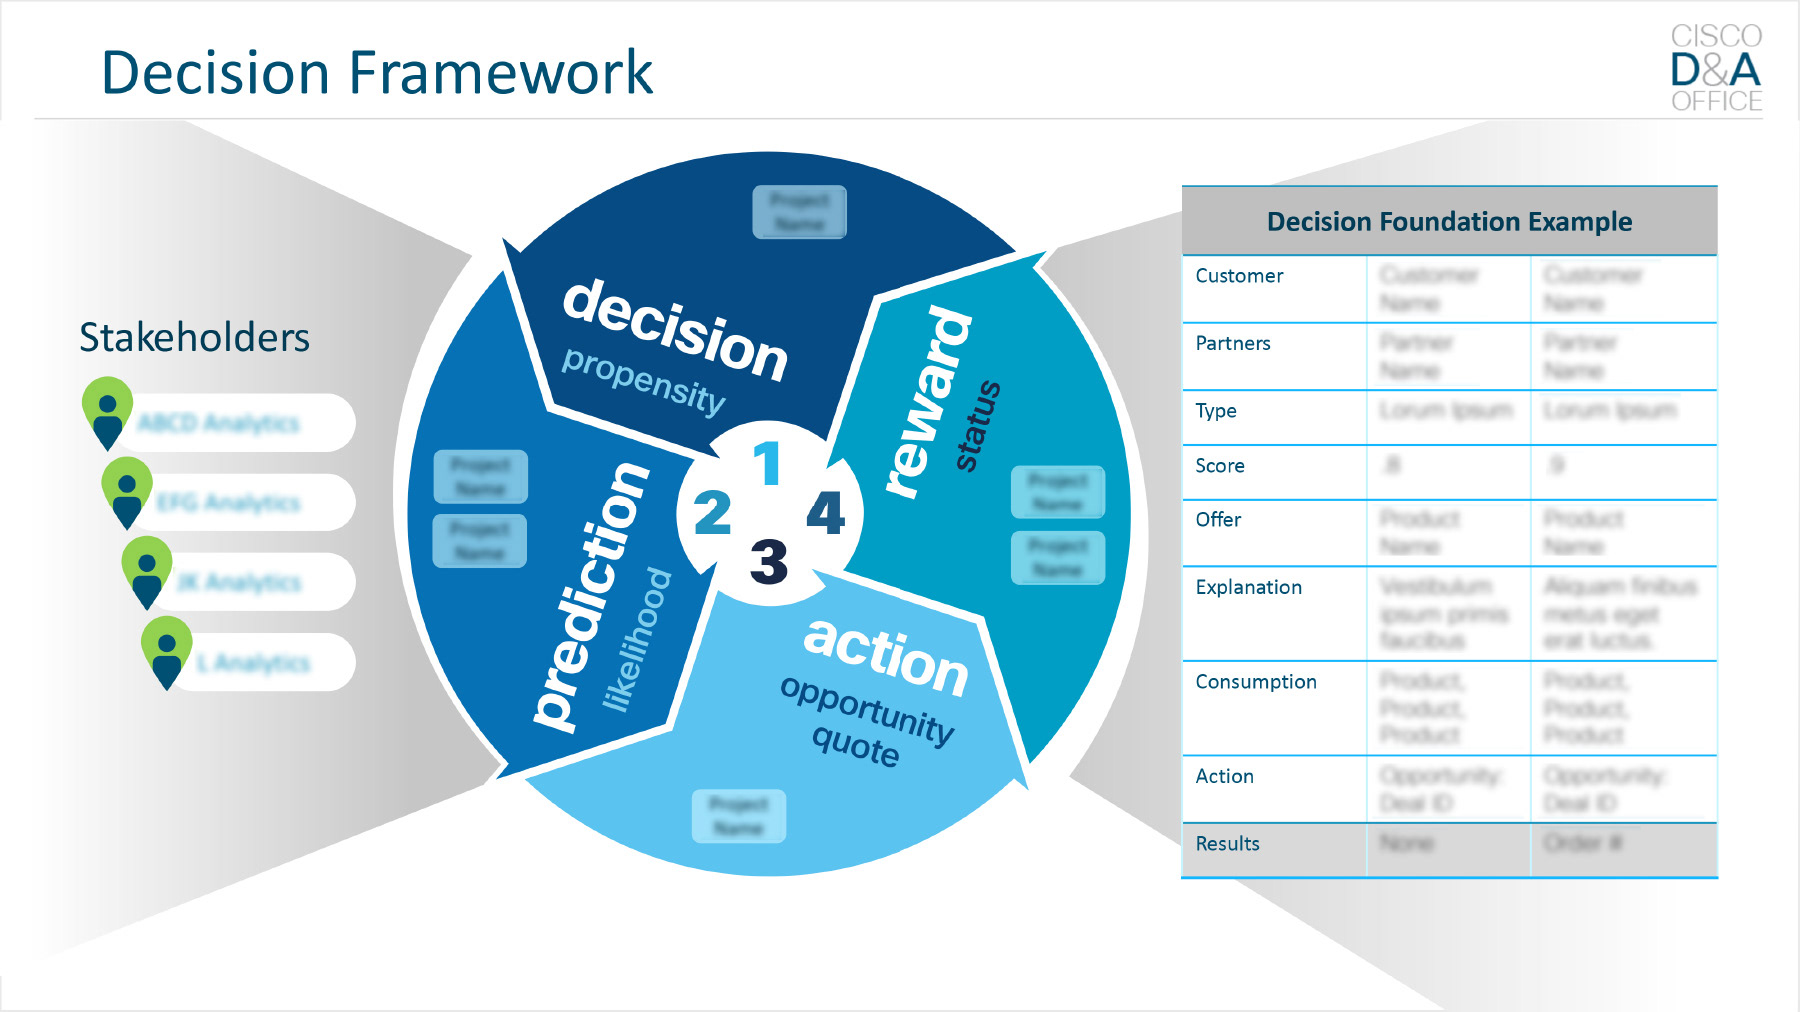

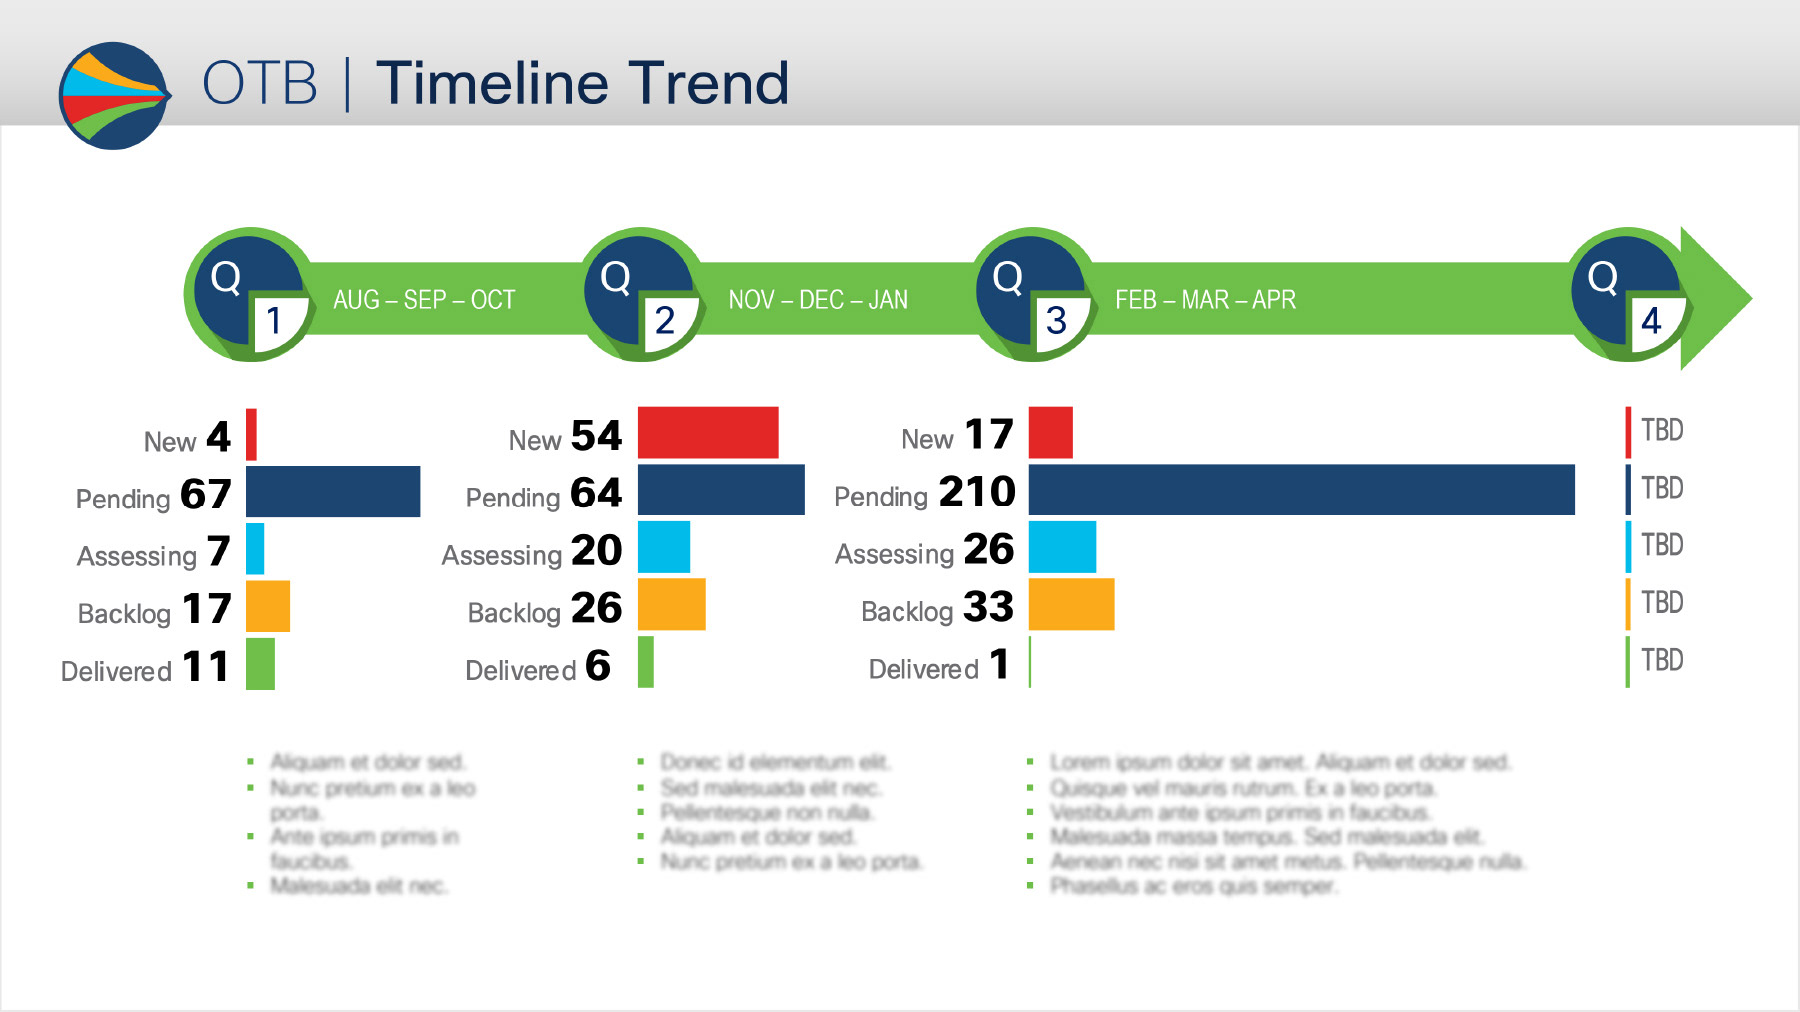
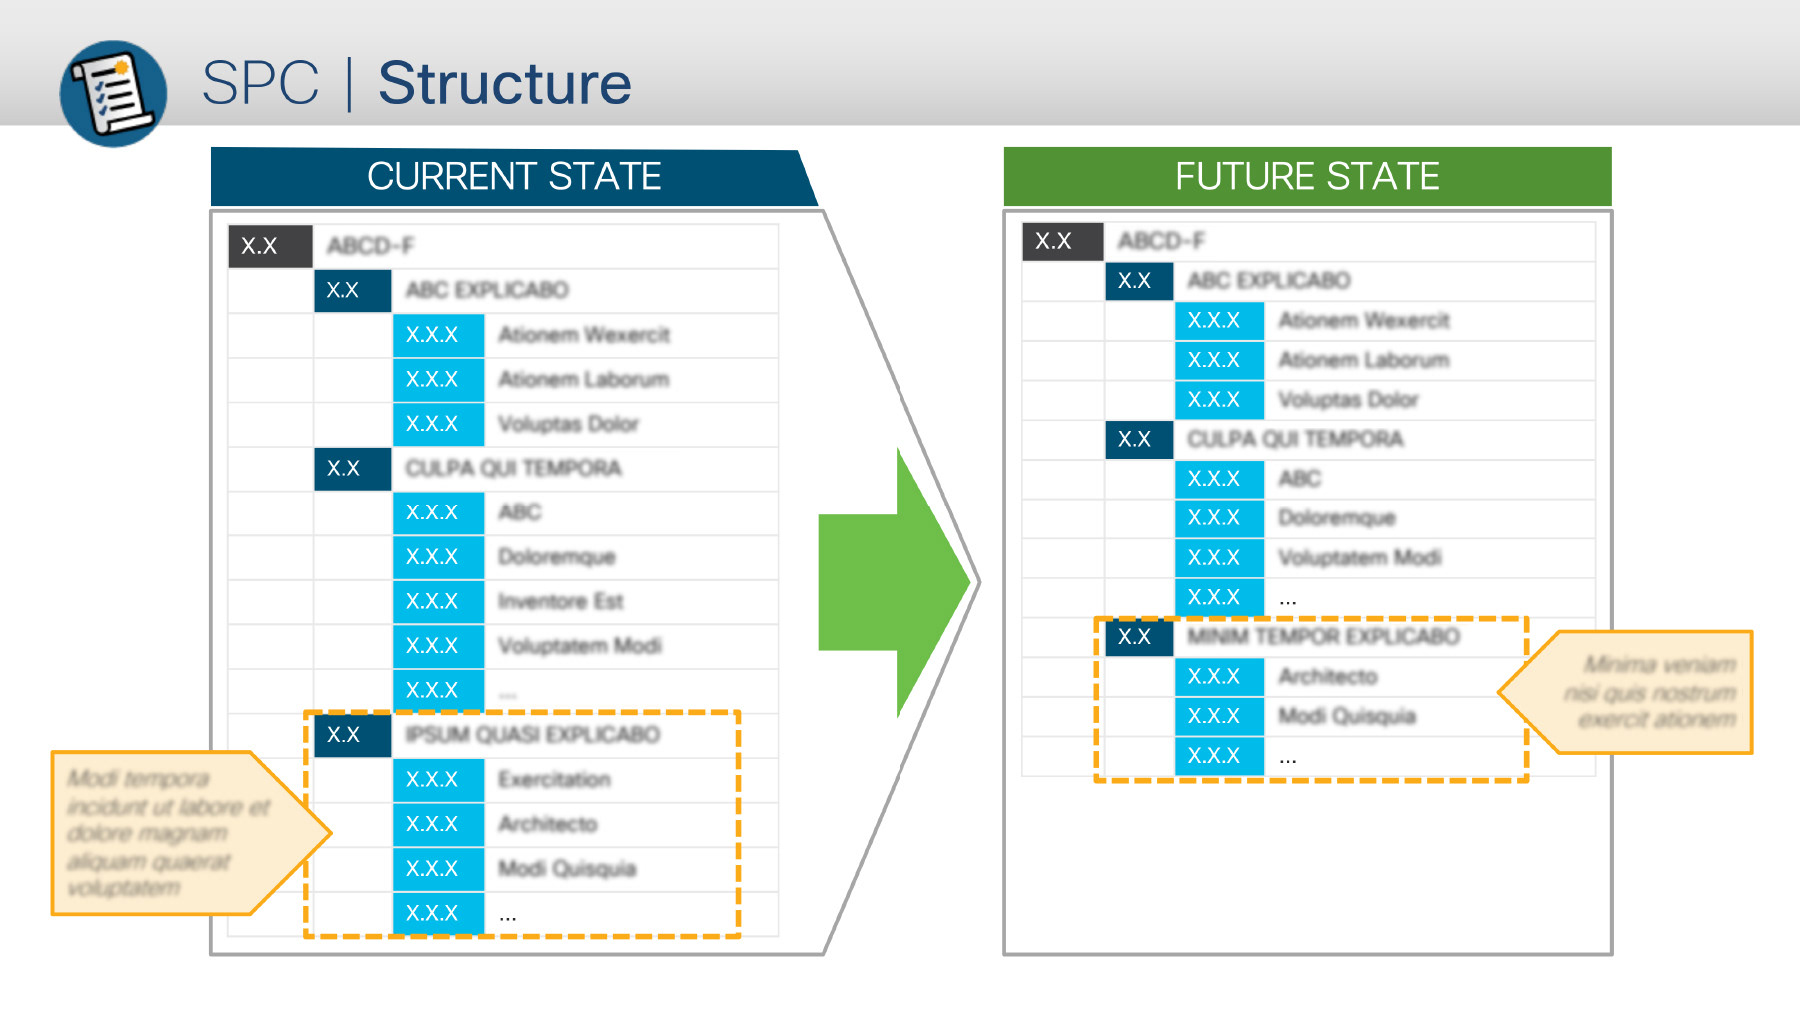
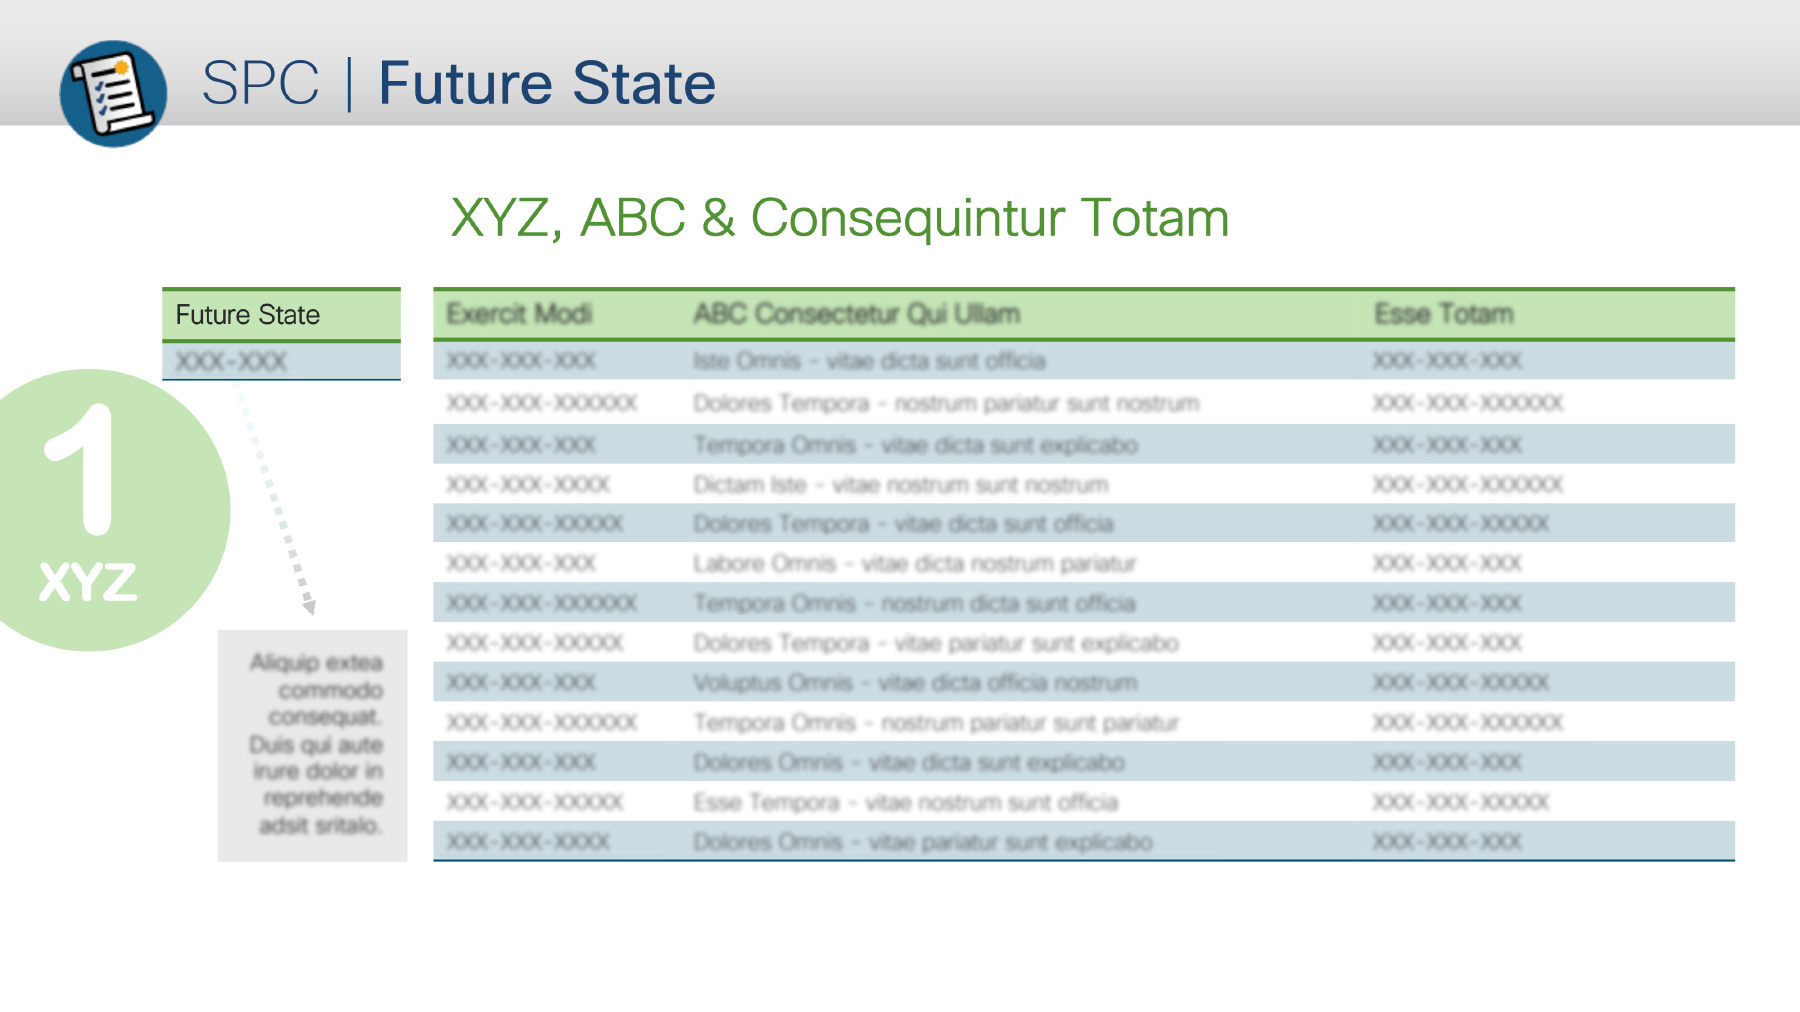
Consistent with Cisco's brand color palette and flat, rounded graphic style, these slides extend the brand language with all new graphics and demonstrate how white space and consistent typography can simplify complex data to tell the story quickly.
*** please note: confidential information has been replaced with generic latin text. ***

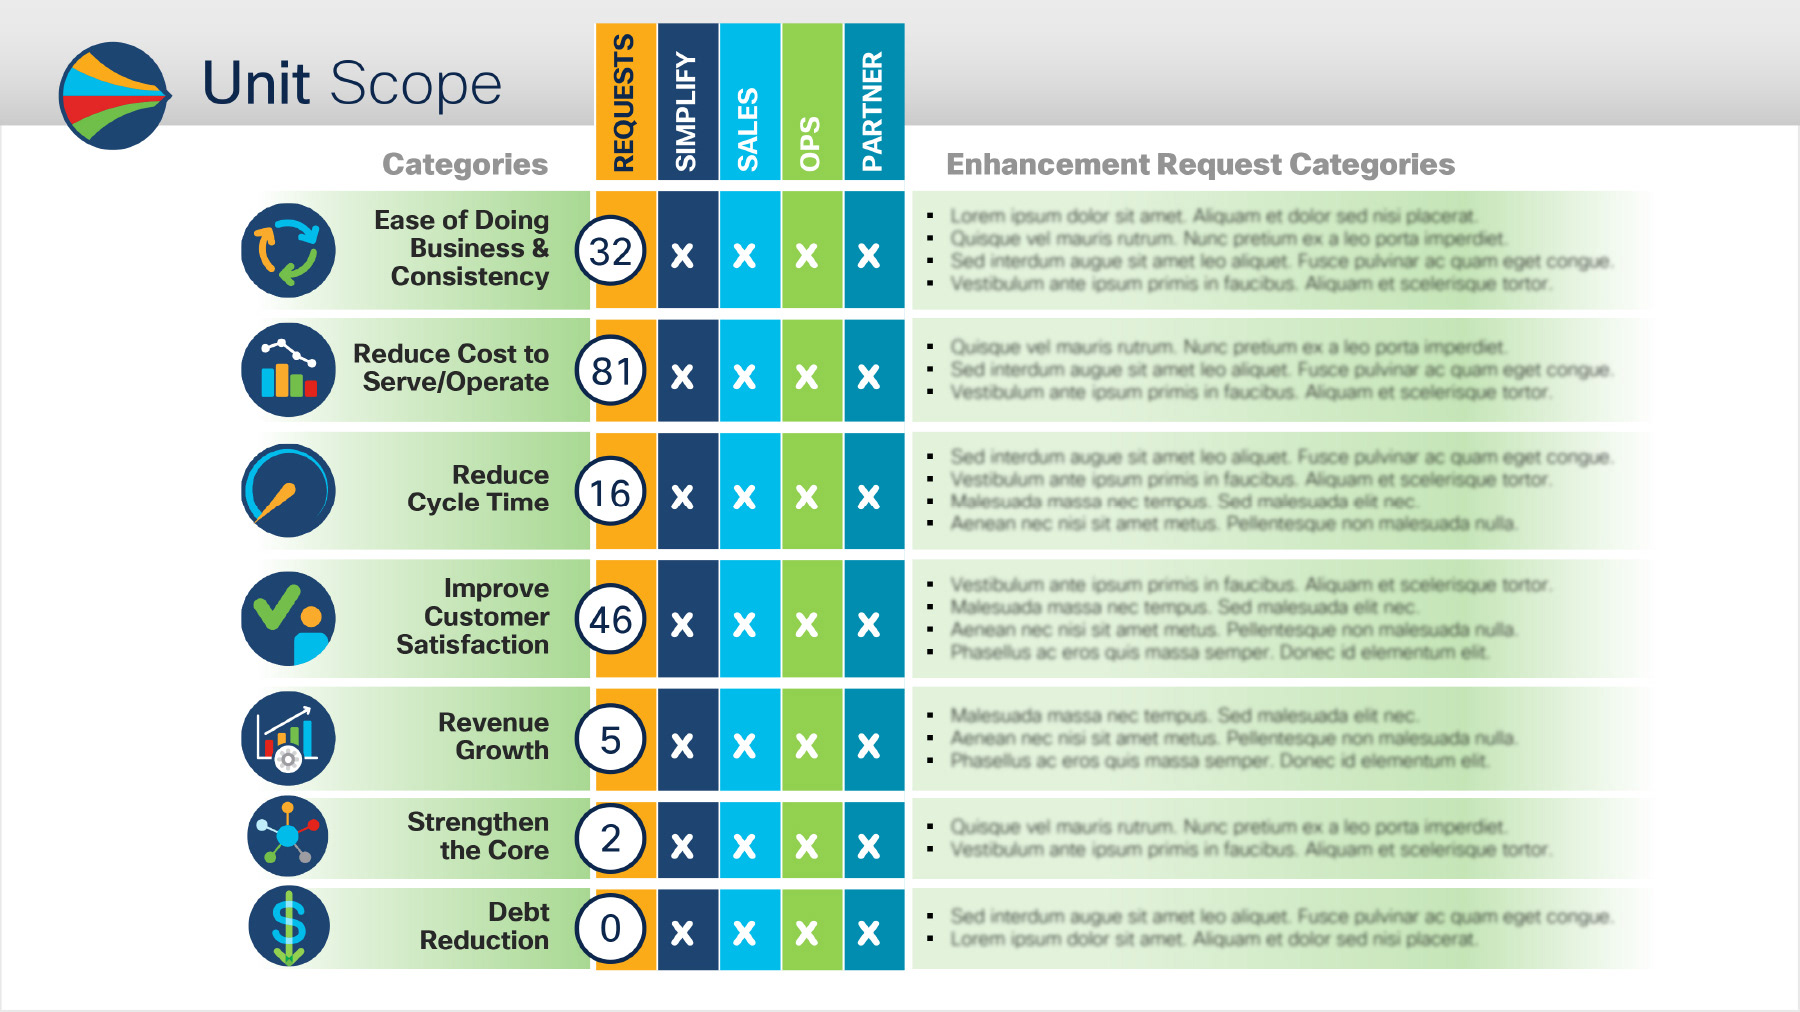

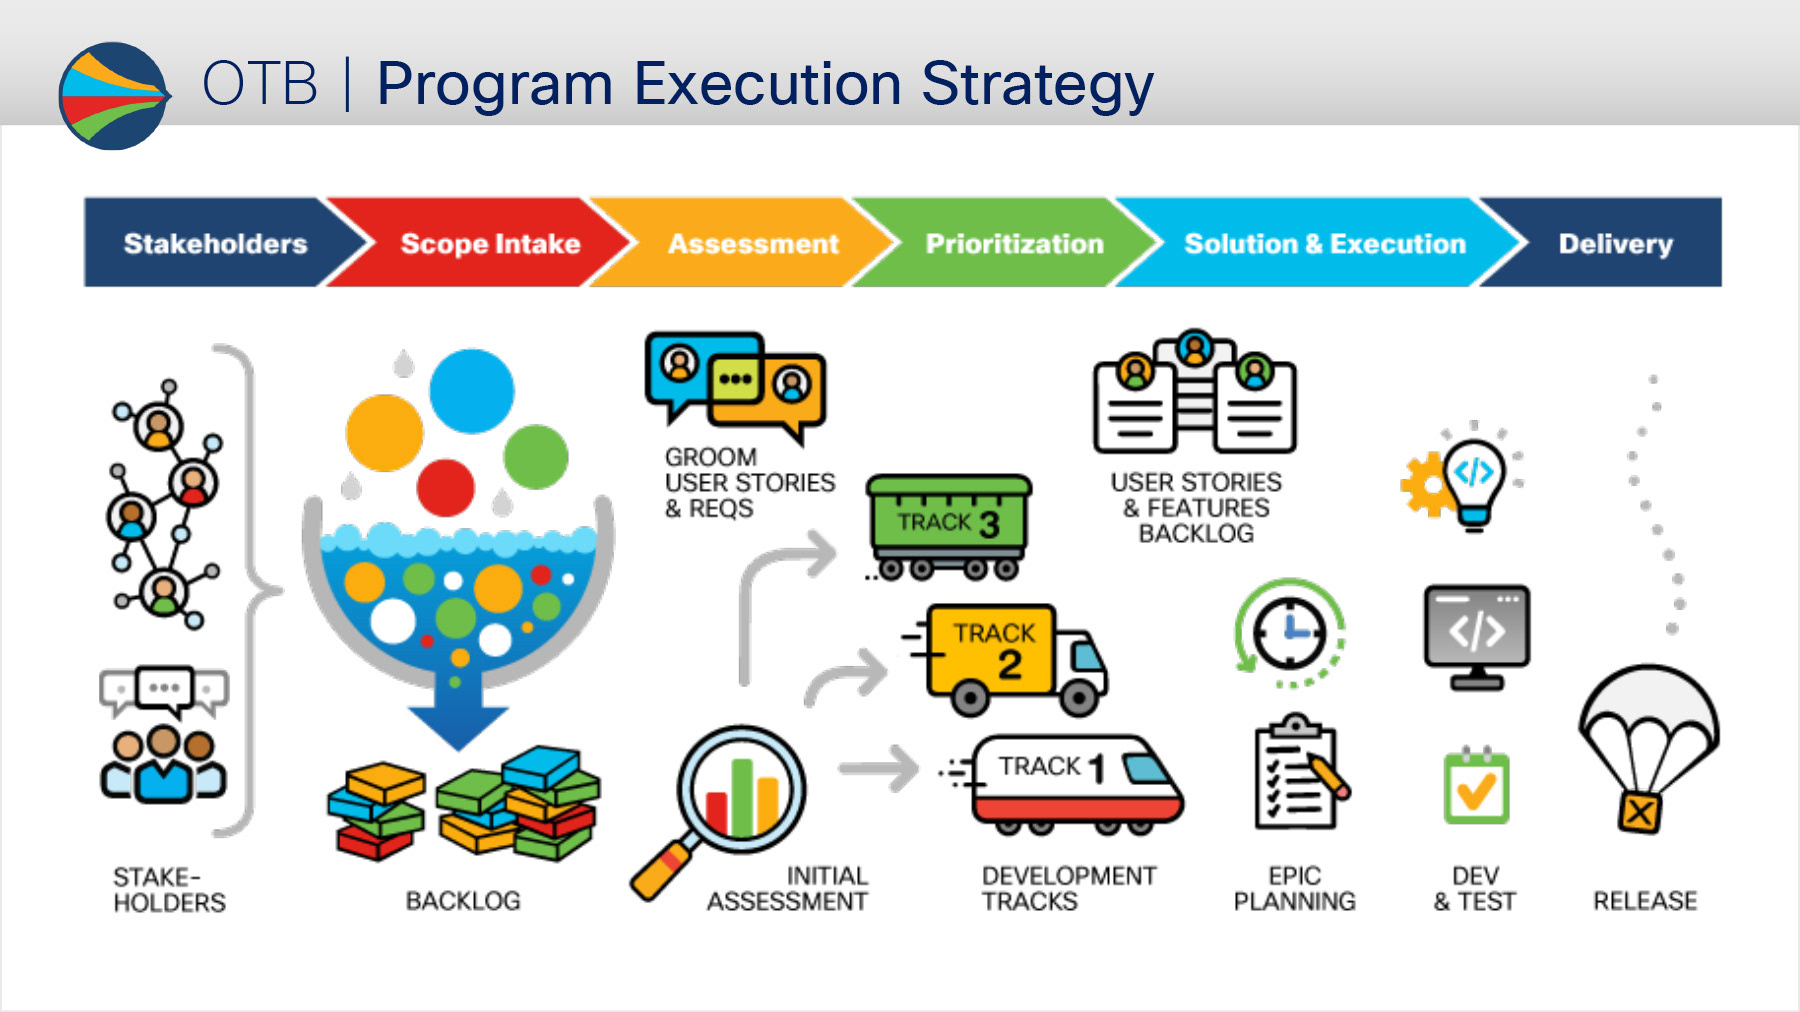

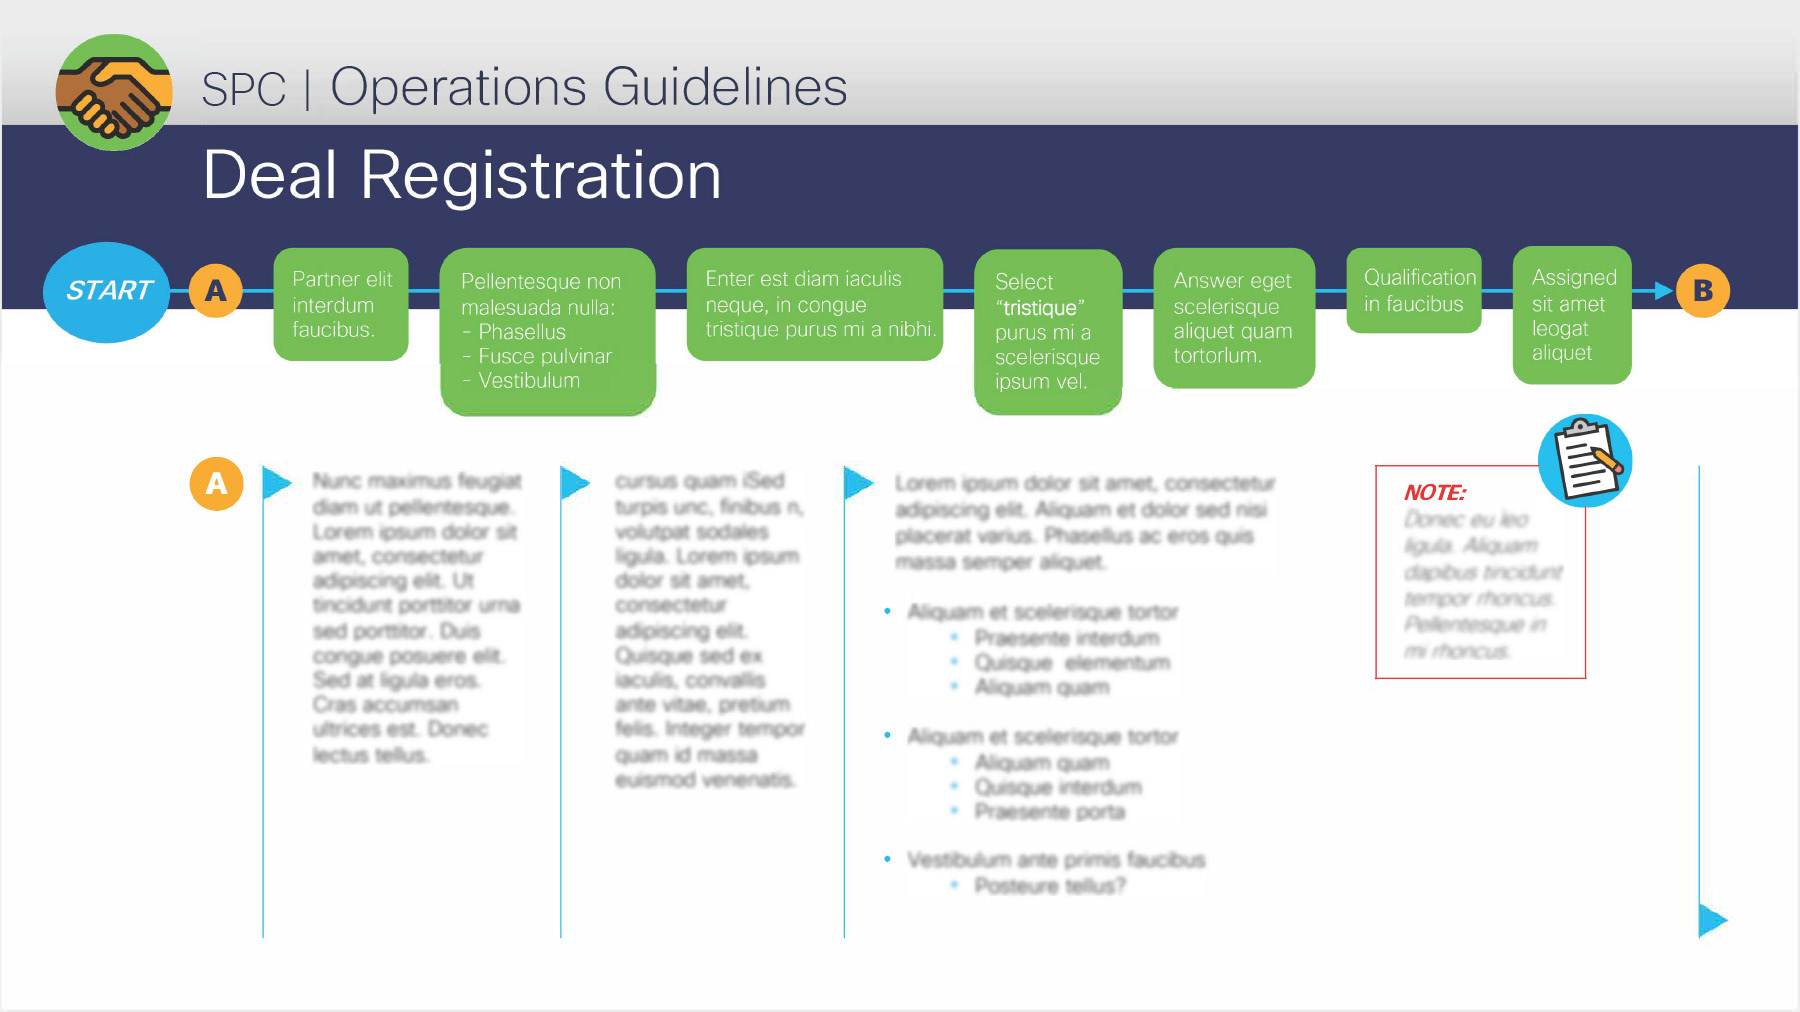
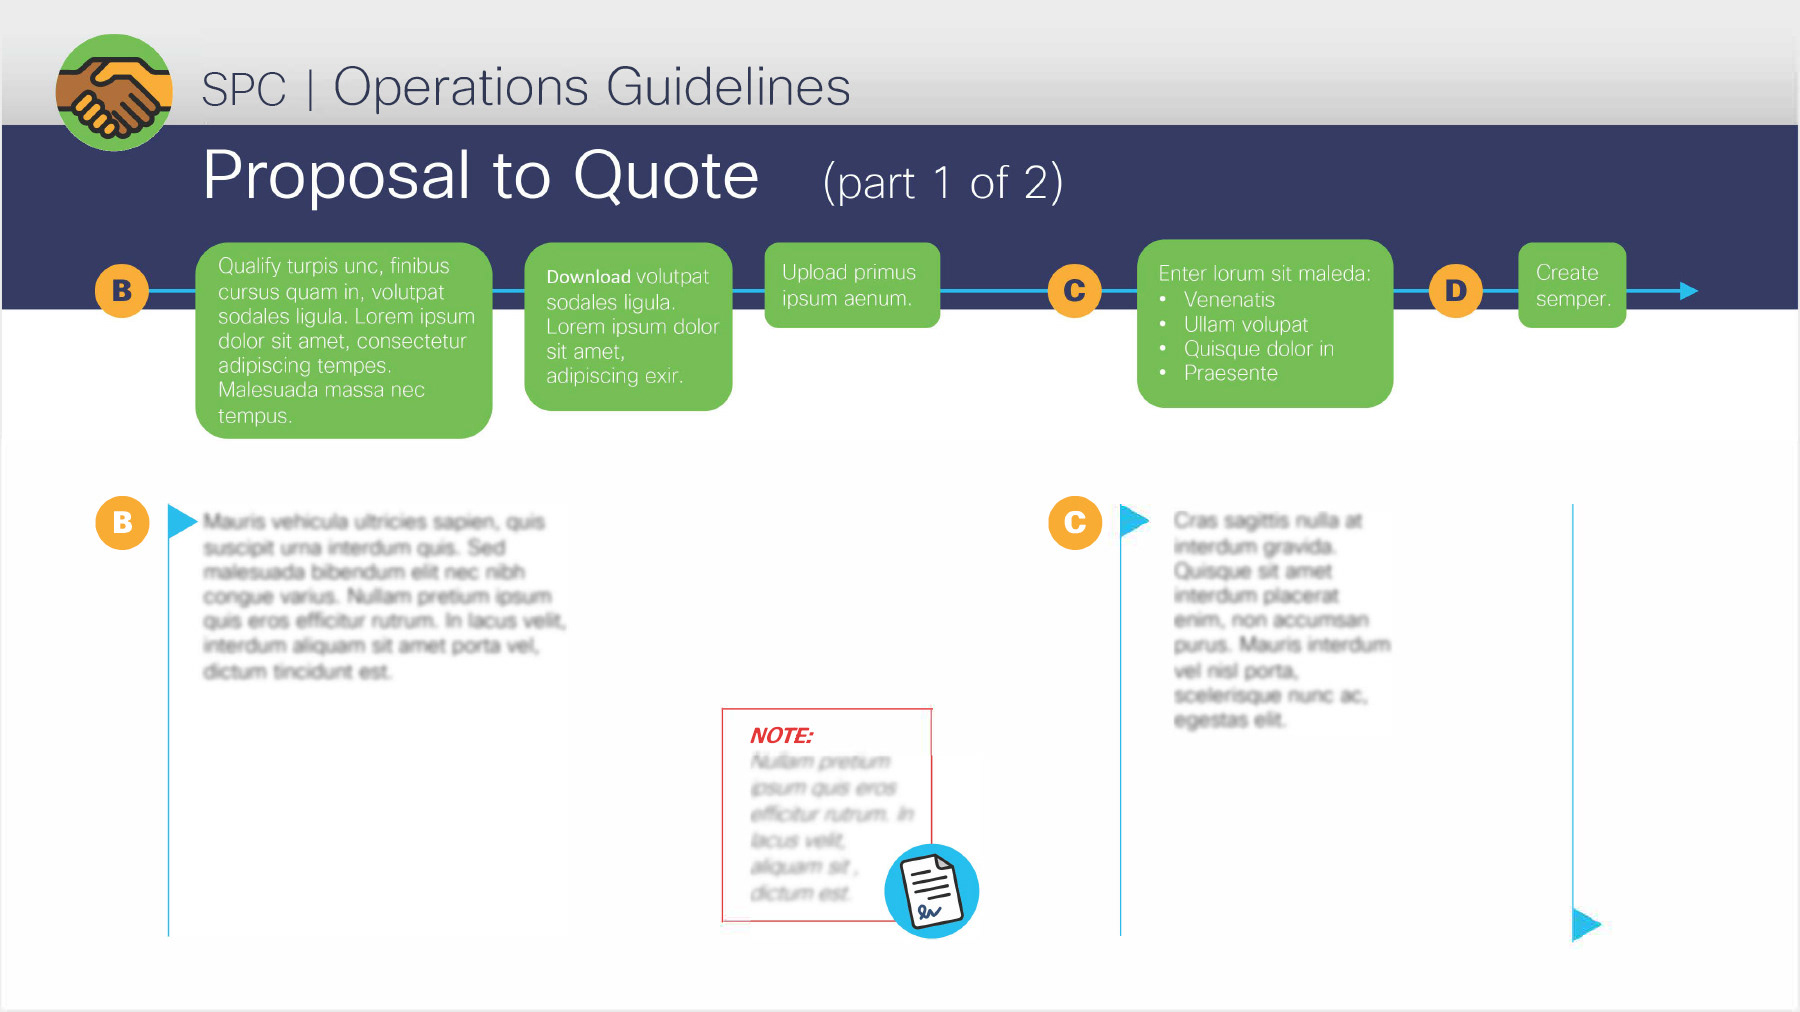
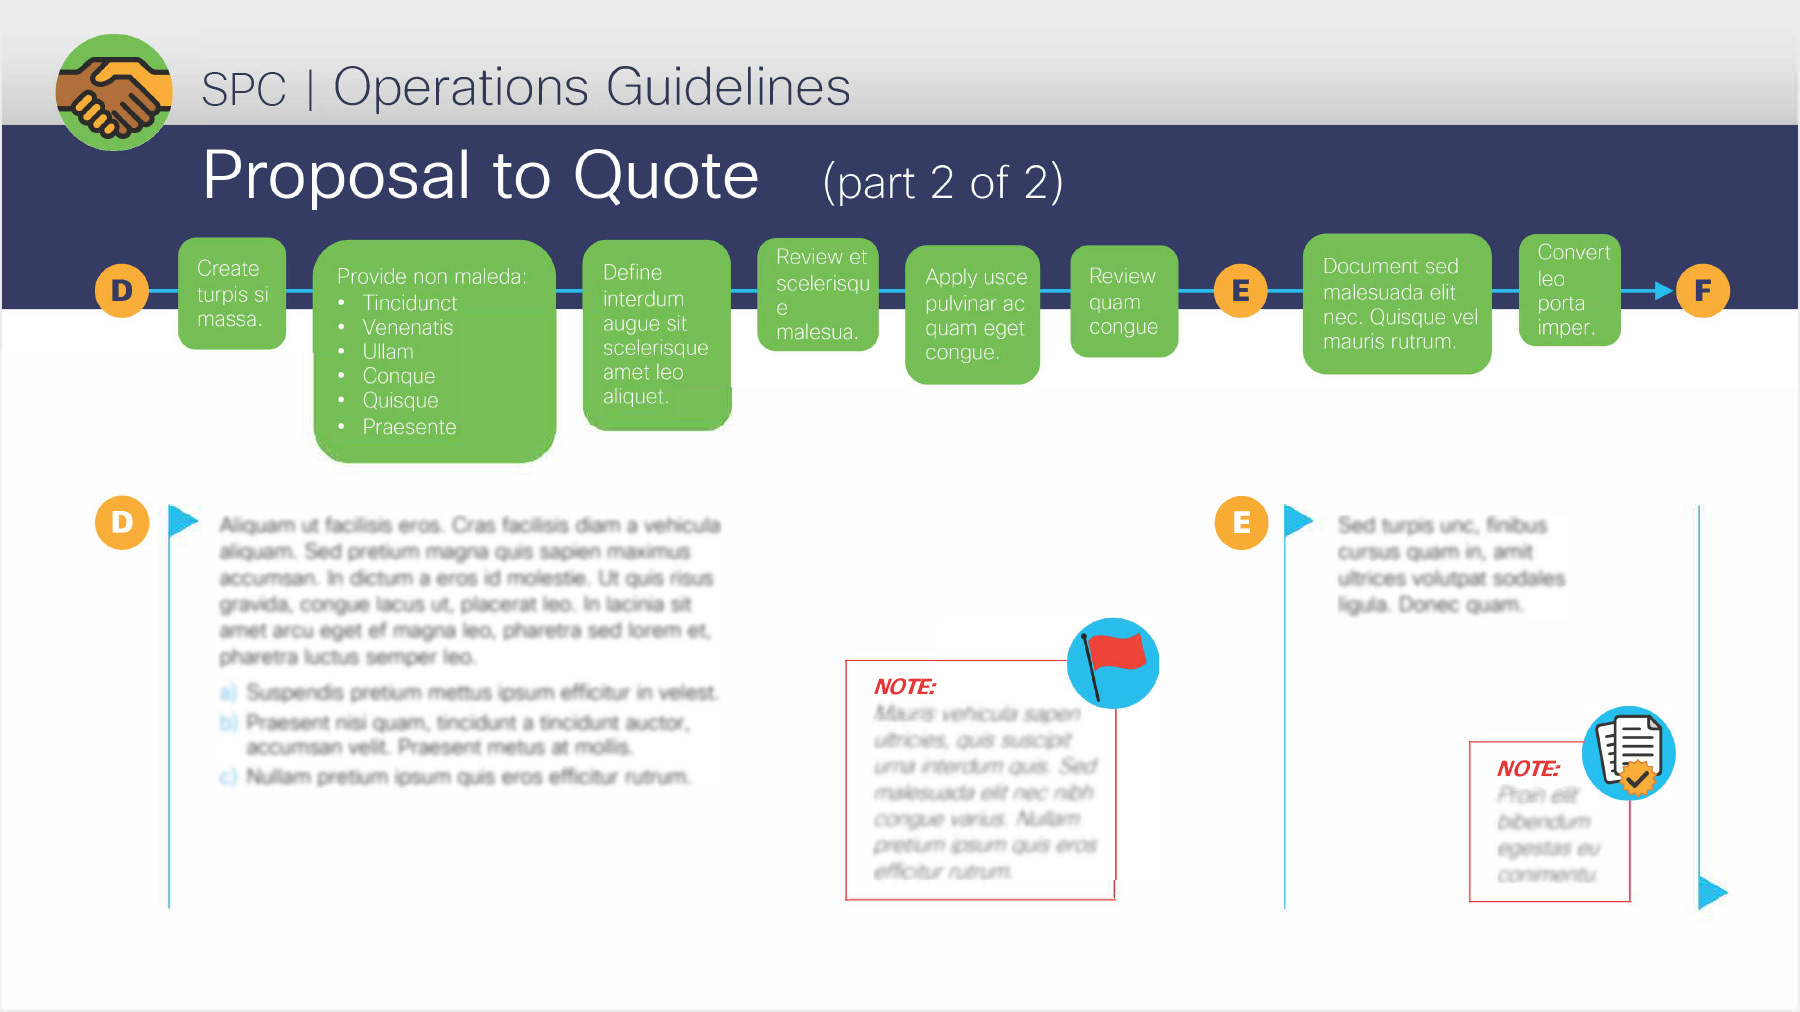
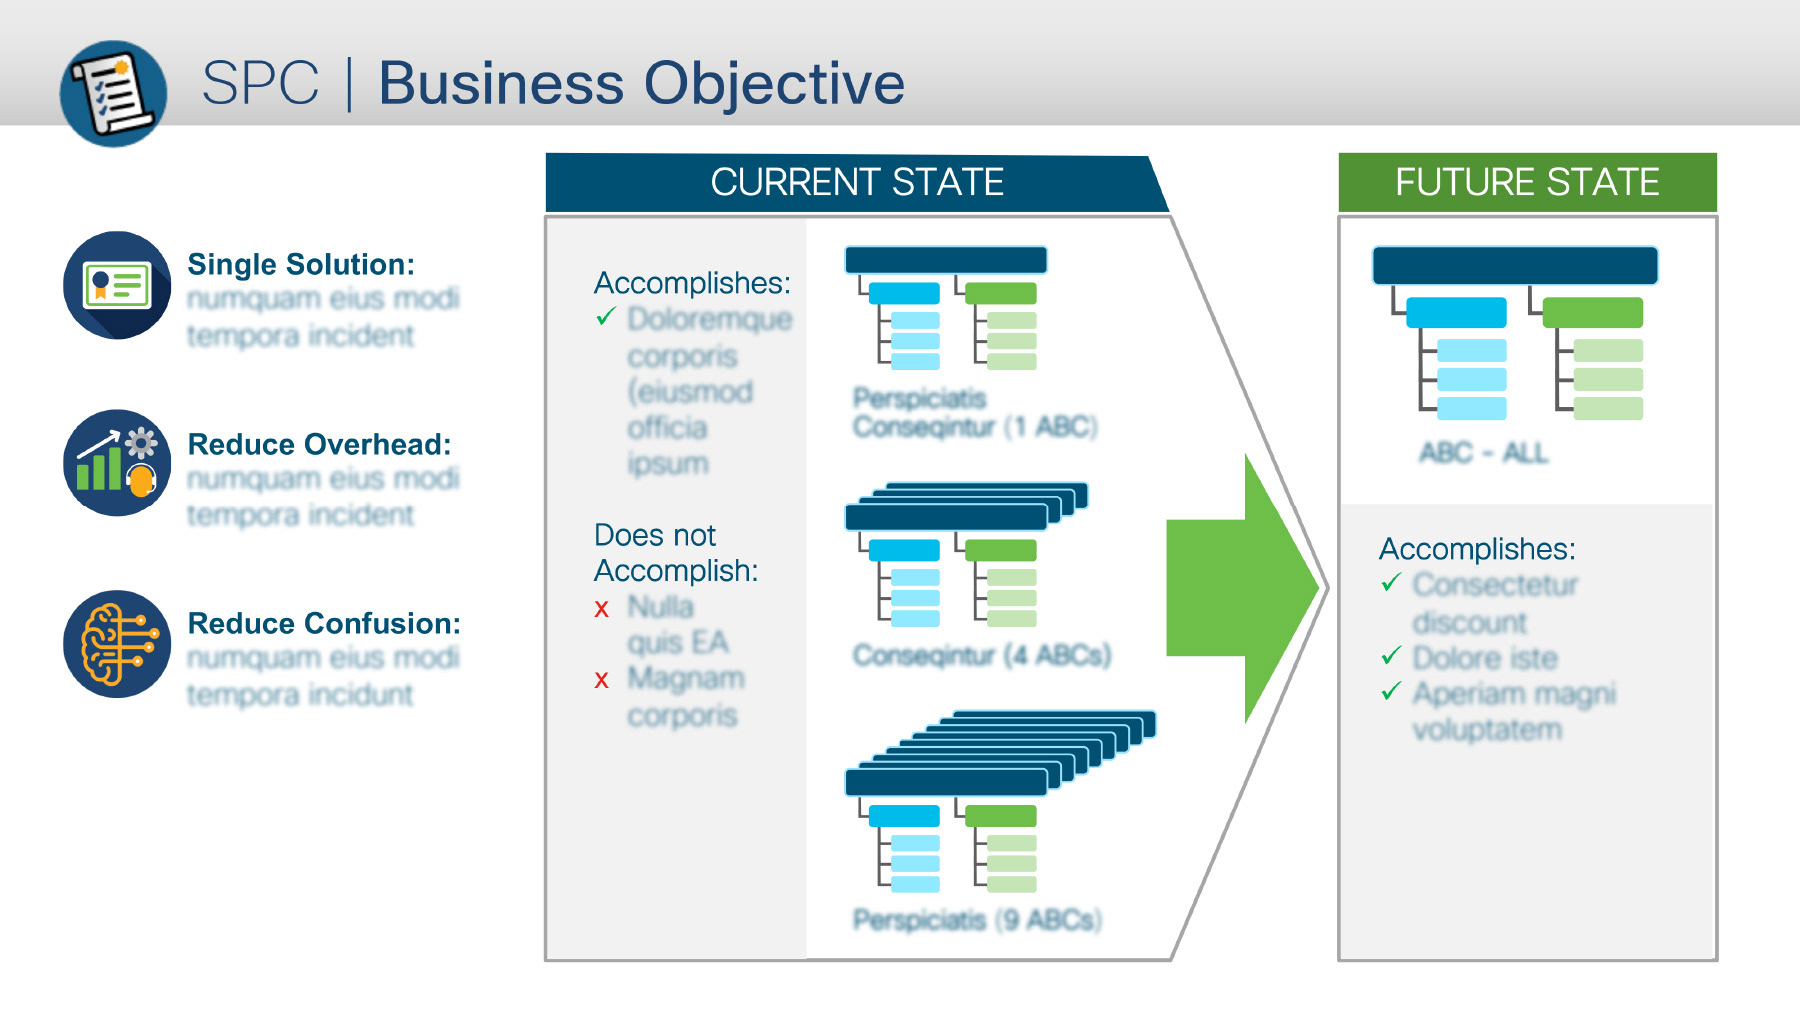
All new iconography set designed to fill gaps in Cisco's icon library. Disarmingly simple and friendly images help clarify changes to a sales process that is extremely complex, abstract and multi-layered in the high-stakes environment of online security and networking.

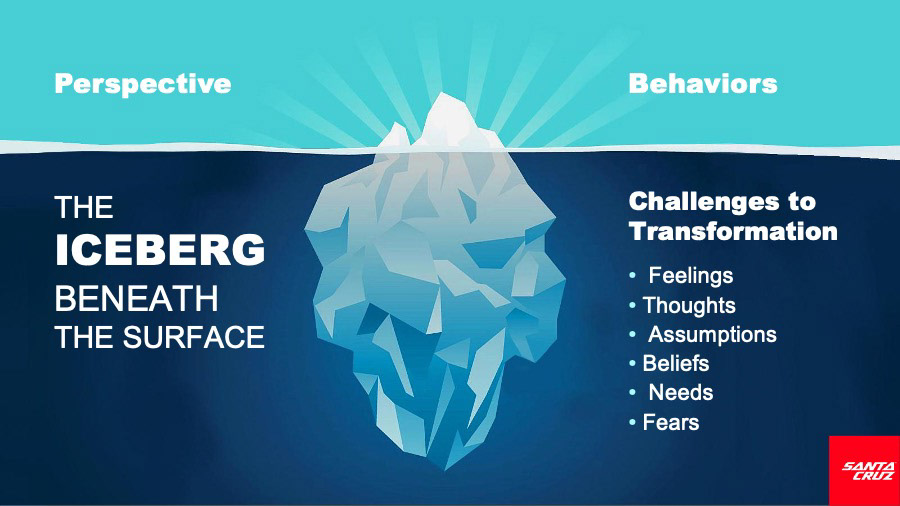
Illustrated slides from a series from "positive leadership" presentations.


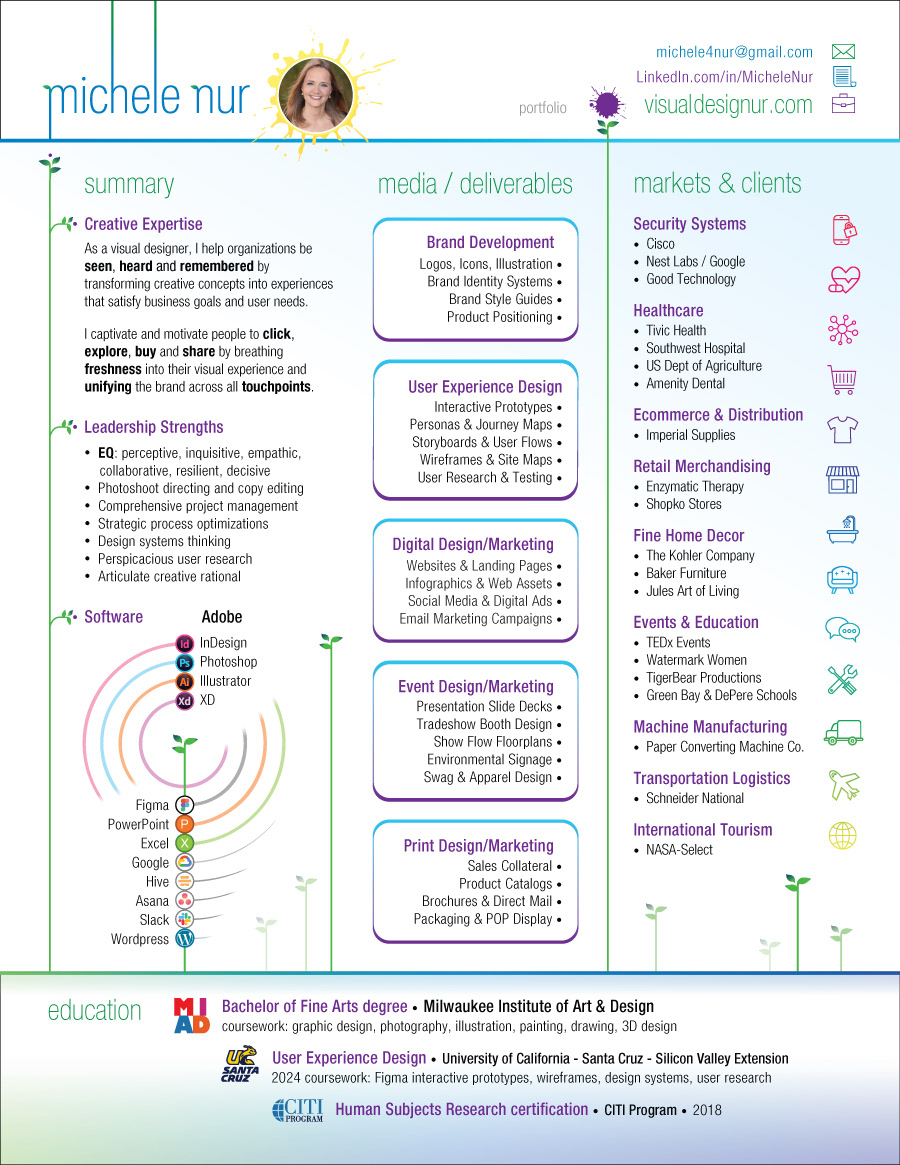
My own wide-ranging career experience and expertise simplified in an infographic.